Home › History › Gold Price Chart
Updated 22 October 2026 · Source: All-Pakistan Sarafa Association
Gold Price Chart in Pakistan: Daily, Yearly and 10-Year Trend
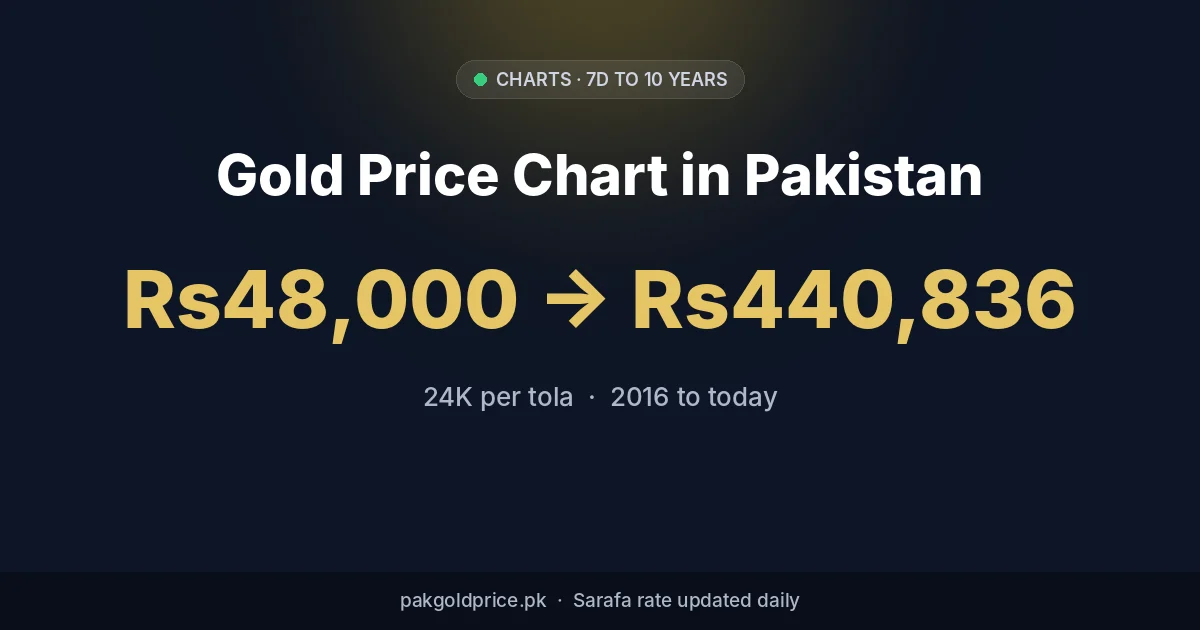
This gold price chart in Pakistan shows the 24K rate per tola over 7 days, 30 days, 1 year and 10 years. Today’s Sarafa rate is Rs434,536 per tola, about 9.1 times its 2016 level and 24% below the January 2026 record of Rs572,862.
Gold Price Chart in Pakistan Today: 7 Days to 1 Year
The gold price chart in Pakistan below lets you switch between 24K, 22K, 21K, 18K and 14K and between 7-day, 30-day, 90-day, 6-month and 1-year views. The line shows the world gold price converted into rupees per tola; the official Sarafa rate of 21 October 2026 is shown alongside it.
Chart: international gold price converted to rupees per tola (spot × interbank USD/PKR). 7D and 30D use daily prices tracked since 26 September 2026; 90D, 6M and 1Y use monthly averages (World Bank / LBMA data) plus the latest daily price. The Sarafa (APGJSA) rate is shown separately and is usually slightly higher because of the local premium.
Tap or hover over the line to see the price on each date. The period high, low and change update as you switch.
Daily Gold Rate Chart: Last 15 Sarafa Announcements
Most online charts plot the world price. This one plots the official All-Pakistan Sarafa Gems and Jewellers Association rate that jewellers actually use. Over the last 15 announcements the 24K rate ranged from Rs434,436 (7 Oct) to Rs442,036 (10 Oct).
Each day’s figures, with the reasons behind every move, are in our daily gold rate updates.
10-Year Gold Price Chart in Pakistan (2016–2026)
Over the last ten years the 24K price per tola rose from about Rs48,000 in 2016 to Rs434,536 today. The steepest climbs came in 2019–2020 and again in 2025, before the record of Rs572,862 in January 2026.
| Period | 24K per tola at start | At end | Change |
|---|---|---|---|
| 2016 → 2020 | Rs48,000 | Rs104,000 | +117% |
| 2020 → 2023 | Rs104,000 | Rs206,500 | +99% |
| 2023 → 2025 | Rs206,500 | Rs371,000 | +80% |
| 2025 → today | Rs371,000 | Rs434,536 | +17% |
Yearly figures are approximate market levels. For every year since 2000 and the events behind each move, see gold price history in Pakistan; for 2026 month by month, see gold price in Pakistan 2026.
Gold Chart in Rupees vs Dollars: Why the Lines Differ
A chart of gold in rupees rises much faster than a chart of gold in dollars, because it also captures the fall of the rupee. With 2016 set to 100, gold in rupees reached about 773 by 2025, while gold in dollars reached about 280 and the dollar rate about 268.
Gold in rupees (773) Gold in dollars (280) Rupees per dollar (268) — 2025, with 2016 = 100
| Year | 24K per tola (Rs) | World gold ($/oz, avg) | Rs per US$ (avg) |
|---|---|---|---|
| 2016 | Rs48,000 | $1,251 | 105 |
| 2017 | Rs50,500 | $1,257 | 106 |
| 2018 | Rs53,000 | $1,268 | 122 |
| 2019 | Rs78,000 | $1,393 | 150 |
| 2020 | Rs104,000 | $1,770 | 162 |
| 2021 | Rs120,700 | $1,799 | 163 |
| 2022 | Rs155,000 | $1,800 | 205 |
| 2023 | Rs206,500 | $1,941 | 280 |
| 2024 | Rs252,500 | $2,386 | 278 |
| 2025 | Rs371,000 | $3,500 | 281 |
Roughly speaking, the rupee price of gold equals the dollar price multiplied by the exchange rate, so a weaker rupee lifts the local rate even when world gold is flat, as in 2022–2023.
How to Read a Gold Price Chart
| Term | What it means on a gold chart |
|---|---|
| Trend | The overall direction over weeks or months; a series of higher lows signals an uptrend |
| Support | A price level where buyers have repeatedly stepped in and stopped falls |
| Resistance | A level where rallies have repeatedly stalled because sellers take profit |
| Moving average | The average price over a set number of days (for example 20 or 100), used to smooth out daily noise |
| Volatility | How much the price swings; Pakistan’s Sarafa rate has moved by Rs3,000–6,000 in a single day this month |
| Percentage vs rupee change | A Rs5,000 move is about 1% today but was over 10% in 2016, so compare percentages across years |
Charts describe what has happened; they cannot tell you what will happen next. Use them to understand the range prices have been moving in before you buy or sell.
Chart Levels to Watch Now
Technical analysts are watching these international levels. Converted to rupees at today’s dollar rate and premium, they correspond roughly to these Sarafa rates:
| Level | World gold ($/oz) | Approx. 24K Sarafa per tola |
|---|---|---|
| Upper resistance | $4,390 | Rs462,584 |
| 100-day average | $4,250 | Rs448,041 |
| 20-day average | $4,220 | Rs444,924 |
| Current world price | $4,120 | Rs434,536 |
| Recent range low | $4,100 | Rs432,458 |
| Key support | $4,045 | Rs426,745 |
For the outlook behind these levels, read our gold price forecast for Pakistan.
Gold Price Chart: Frequently Asked Questions
Where can I see a live gold price chart in Pakistan?
The interactive chart at the top of this page shows 24K to 14K gold over 7 days to 1 year and updates every day with the new Sarafa rate.
How much has gold risen in Pakistan in 10 years?
From about Rs48,000 per tola in 2016 to Rs434,536 today, roughly 9.1 times.
Why does the chart differ from the Sarafa rate?
Most charts plot the world price converted into rupees. The Sarafa rate adds a small local premium, so it is usually slightly higher.
What was the highest point on the gold chart in Pakistan?
The record was Rs572,862 per tola for 24K on 29–30 January 2026.
Why does gold rise faster in rupees than in dollars?
Because the rupee has weakened against the dollar over the years, which adds to the rise in the world gold price.
Can a chart predict the gold price?
No. Charts show past movements and common reference levels, but prices can break out in either direction.
Related Gold Rates and Tools
Rates are for information only and exclude making charges, kat and dealer premiums. Not investment advice. See our disclaimer and methodology. Official daily rate source: All-Pakistan Sarafa Gems and Jewellers Association rates (Business Recorder).